Involve Prometheus
This article describes how to enable Prometheus to monitor all running Linkis services.
1. Introduction to Prometheus
1.1 What is Prometheus
Prometheus, a Cloud Native Computing Foundation project, is a systems and service monitoring system. It collects metrics from configured targets at given intervals, evaluates rule expressions, displays the results, and can trigger alerts when specified conditions are observed.
In the context of microservice, it provides the service discovery feature, enabling to find targets dynamically from service register center, like Eureka, Consul, etc, and pull the metrics from API endpoint over http protocol.
1.2 Prometheus Architecture
This diagram illustrates the architecture of Prometheus and some of its ecosystem components:

Prometheus scrapes metrics from instrumented jobs, either directly or via an intermediary push gateway for short-lived jobs. It stores all scraped samples locally and runs rules over this data to either aggregate and record new time series from existing data or generate alerts. Grafana or other API consumers can be used to visualize the collected data.
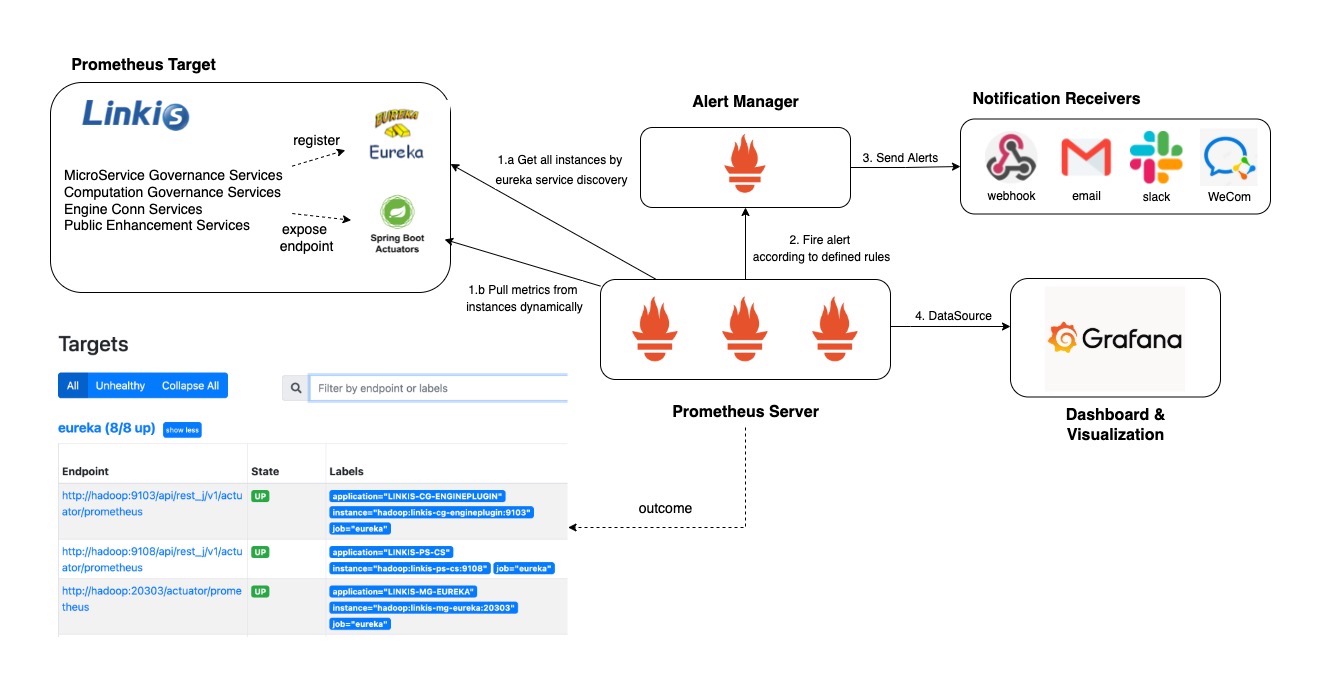
In the context of Linkis, we will use Eureka (Service Discover)SD in Prometheus to retrieve scrape targets using the Eureka REST API. And Prometheus will periodically check the REST endpoint and create a target for every app instance.
2. How to Enable Prometheus
2.1 Enable Prometheus when installing Linkis
Modify the configuration item PROMETHEUS_ENABLE in linkis-env.sh of Linkis.
export PROMETHEUS_ENABLE=true
After running the install.sh, it's expected to see the configuration related to prometheus is appended inside the following files:
## application-linkis.yml  ##

eureka:
  instance:
    metadata-map:
      prometheus.path: ${prometheus.path:${prometheus.endpoint}}
...
management:
  endpoints:
    web:
      exposure:
        include: refresh,info,health,metrics,prometheus
## application-eureka.yml  ##

eureka:
  instance:
    metadata-map:
      prometheus.path: ${prometheus.path:/actuator/prometheus}
...
management:
  endpoints:
    web:
      exposure:
        include: refresh,info,health,metrics,prometheus
## linkis.properties ##
...
wds.linkis.prometheus.enable=true
wds.linkis.server.user.restful.uri.pass.auth=/api/rest_j/v1/actuator/prometheus,
...
Then inside each computation engine, like spark, flink or hive, it's needed to add the same configuration manually.
## linkis-engineconn.properties  ##
...
wds.linkis.prometheus.enable=true
wds.linkis.server.user.restful.uri.pass.auth=/api/rest_j/v1/actuator/prometheus,
...
2.2 Enable Prometheus after installation
Modify${LINKIS_HOME}/conf/application-linkis.yml, add prometheus as exposed endpoints.
## application-linkis.yml  ##
management:
  endpoints:
    web:
      exposure:
        #Add prometheus
        include: refresh,info,health,metrics,prometheus
Modify${LINKIS_HOME}/conf/application-eureka.yml, add prometheus as exposed endpoints.
## application-eureka.yml  ##
management:
  endpoints:
    web:
      exposure:
        #Add prometheus
        include: refresh,info,health,metrics,prometheus
Modify${LINKIS_HOME}/conf/linkis.properties, remove the comment # before prometheus.enable
## linkis.properties ##
...
wds.linkis.prometheus.enable=true
...
2.3 Start Linkis
$ bash linkis-start-all.sh
After start the services, it's expected to access the prometheus endpoint of each microservice in the Linkis, for example, http://linkishost:9103/api/rest_j/v1/actuator/prometheus.
The prometheus endpoint of gateway/eureka don't include the prefix api/rest_j/v1, and the complete endpoint will be http://linkishost:9001/actuator/prometheus
3. Demo for Deploying the Prometheus, Alertmanager and Grafana
Usually the monitoring setup for a cloud native application will be deployed on kubernetes with service discovery and high availability (e.g. using a kubernetes operator like Prometheus Operator). To quickly prototype dashboards and experiment with different metric type options (e.g. histogram vs gauge) you may need a similar setup locally. This sector explains how to setup locally a Prometheus/Alert Manager and Grafana monitoring stack with Docker Compose.
First, lets define a general component of the stack as follows:
An Alert Manager container that exposes its UI at 9093 and read its configuration from alertmanager.conf
A Prometheus container that exposes its UI at 9090 and read its configuration from prometheus.yml and its list of alert rules from alert_rules.yml
A Grafana container that exposes its UI at 3000, with list of metrics sources defined in grafana_datasources.yml and configuration in grafana_config.ini
The following docker-compose.yml file summaries the configuration of all those components:
## docker-compose.yml ##
version: "3"
networks:
  default:
    external: true
    name: my-network
services:
  prometheus:
    image: prom/prometheus:latest
    container_name: prometheus
    volumes:
      - ./config/prometheus.yml:/etc/prometheus/prometheus.yml
      - ./config/alertrule.yml:/etc/prometheus/alertrule.yml
      - ./prometheus/prometheus_data:/prometheus
    command:
      - '--config.file=/etc/prometheus/prometheus.yml'
    ports:
      - "9090:9090"

  alertmanager:
    image: prom/alertmanager:latest
    container_name: alertmanager
    volumes:
      - ./config/alertmanager.yml:/etc/alertmanager/alertmanager.yml
    ports:
      - "9093:9093"

  grafana:
    image: grafana/grafana:latest
    container_name: grafana
    environment:
      - GF_SECURITY_ADMIN_PASSWORD=123456
      - GF_USERS_ALLOW_SIGN_UP=false
    volumes:
      - ./grafana/provisioning/dashboards:/etc/grafana/provisioning/dashboards
      - ./grafana/provisioning/datasources:/etc/grafana/provisioning/datasources
      - ./grafana/grafana_data:/var/lib/grafana
    ports:
      - "3000:3000"
Second, to define some alerts based on metrics in Prometheus, you can group then into an alert_rules.yml, so you could validate those alerts are properly triggered in your local setup before configuring them in the production instance. As an example, the following configration convers the usual metrics used to monitor Linkis services.
- a. Down instance
- b. High Cpu for each JVM instance (>80%)
- c. High Heap memory for each JVM instance (>80%)
- d. High NonHeap memory for each JVM instance (>80%)
- e. High Waiting thread for each JVM instance (100)
## alertrule.yml ##
groups:
  - name: LinkisAlert
    rules:
      - alert: LinkisNodeDown
        expr: last_over_time(up{job="linkis", application=~"LINKISI.*", application!="LINKIS-CG-ENGINECONN"}[1m])== 0
        for: 15s
        labels:
          severity: critical
          service: Linkis
          instance: "{{ $labels.instance }}"
        annotations:
          summary: "instance: {{ $labels.instance }} down"
          description: "Linkis instance(s) is/are down in last 1m"
          value: "{{ $value }}"

      - alert: LinkisNodeCpuHigh
        expr: system_cpu_usage{job="linkis", application=~"LINKIS.*"} >= 0.8
        for: 1m
        labels:
          severity: warning
          service: Linkis
          instance: "{{ $labels.instance }}"
        annotations:
          summary: "instance: {{ $labels.instance }} cpu overload"
          description: "CPU usage is over 80% for over 1min"
          value: "{{ $value }}"

      - alert: LinkisNodeHeapMemoryHigh
        expr: sum(jvm_memory_used_bytes{job="linkis", application=~"LINKIS.*", area="heap"}) by(instance) *100/sum(jvm_memory_max_bytes{job="linkis", application=~"LINKIS.*", area="heap"}) by(instance) >= 50
        for: 1m
        labels:
          severity: warning
          service: Linkis
          instance: "{{ $labels.instance }}"
        annotations:
          summary: "instance: {{ $labels.instance }} memory(heap) overload"
          description: "Memory usage(heap) is over 80% for over 1min"
          value: "{{ $value }}"

      - alert: LinkisNodeNonHeapMemoryHigh
        expr: sum(jvm_memory_used_bytes{job="linkis", application=~"LINKIS.*", area="nonheap"}) by(instance) *100/sum(jvm_memory_max_bytes{job="linkis", application=~"LINKIS.*", area="nonheap"}) by(instance) >= 60
        for: 1m
        labels:
          severity: warning
          service: Linkis
          instance: "{{ $labels.instance }}"
        annotations:
          summary: "instance: {{ $labels.instance }} memory(nonheap) overload"
          description: "Memory usage(nonheap) is over 80% for over 1min"
          value: "{{ $value }}"

      - alert: LinkisWaitingThreadHigh
        expr: jvm_threads_states_threads{job="linkis", application=~"LINKIS.*", state="waiting"} >= 100
        for: 1m
        labels:
          severity: warning
          service: Linkis
          instance: "{{ $labels.instance }}"
        annotations:
          summary: "instance: {{ $labels.instance }} waiting threads is high"
          description: "waiting threads is over 100 for over 1min"
          value: "{{ $value }}"
Note: Since once the service instance is shutdown, it will not be one of the target of Prometheus Eureka SD, and up metrics will not return any data after a short time. Thus we will collect if the up=0 in the last one minute to determine whether the service is alive or not.
Third, and most importantly define Prometheus configuration in prometheus.yml file. This will defines:
- the global settings like scrapping interval and rules evaluation interval
- the connection information to reach AlertManager and the rules to be evaluated
- the connection information to application metrics endpoint. This is an example configration file for Linkis:
## prometheus.yml ##
# my global config
global:
  scrape_interval:     30s # By default, scrape targets every 15 seconds.
  evaluation_interval: 30s # By default, scrape targets every 15 seconds.
alerting:
  alertmanagers:
    - static_configs:
        - targets: ['alertmanager:9093']
# Load and evaluate rules in this file every 'evaluation_interval' seconds.
rule_files:
  - "alertrule.yml"

# A scrape configuration containing exactly one endpoint to scrape:
# Here it's Prometheus itself.
scrape_configs:
  - job_name: 'prometheus'
    static_configs:
      - targets: ['localhost:9090']
  - job_name: linkis
    eureka_sd_configs:
      # the endpoint of your eureka instance
      - server: {{linkis-host}}:20303/eureka
    relabel_configs:
      - source_labels: [__meta_eureka_app_name]
        target_label: application
      - source_labels: [__meta_eureka_app_instance_metadata_prometheus_path]
        action: replace
        target_label: __metrics_path__
        regex: (.+)
Forth, the following configuration defines how alerts will be sent to external webhook.
## alertmanager.yml ##
global:
  resolve_timeout: 5m

route:
  receiver: 'webhook'
  group_by: ['alertname']

  # How long to wait to buffer alerts of the same group before sending a notification initially.
  group_wait: 1m
  # How long to wait before sending an alert that has been added to a group for which there has already been a notification.
  group_interval: 5m
  # How long to wait before re-sending a given alert that has already been sent in a notification.
  repeat_interval: 12h

receivers:
- name: 'webhook'
  webhook_configs:
  - send_resolved: true
    url: {{your-webhook-url}}
Finally, after defining all the configuration file as well as the docker compose file we can start the monitoring stack with docker-compose up
4. Result display
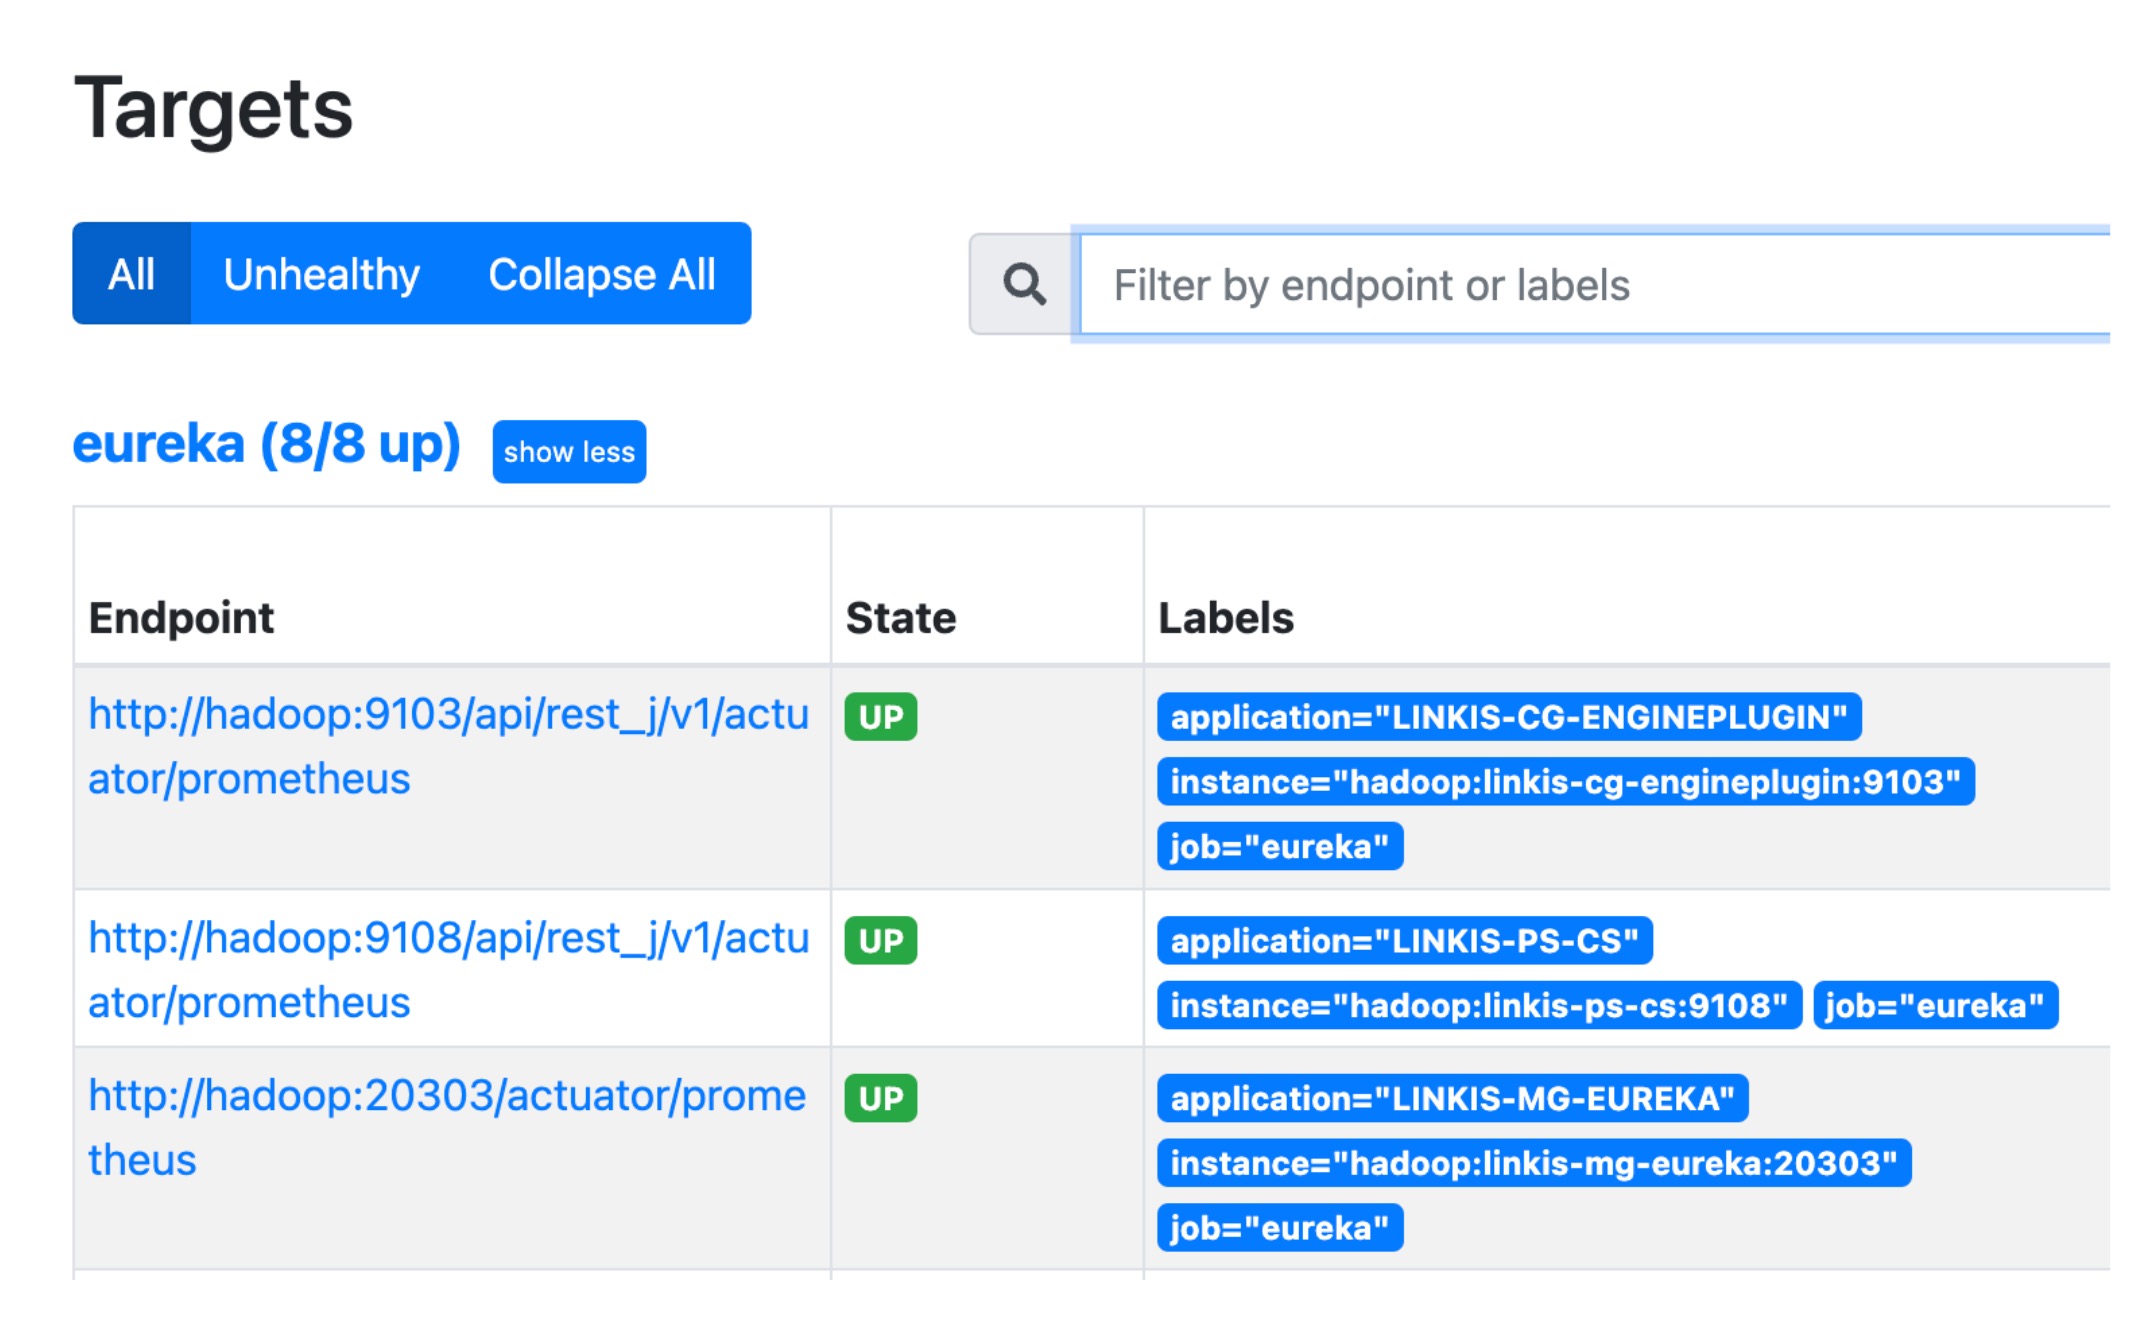
On Prometheus page, it's expected to see all the Linkis service instances as shown below:
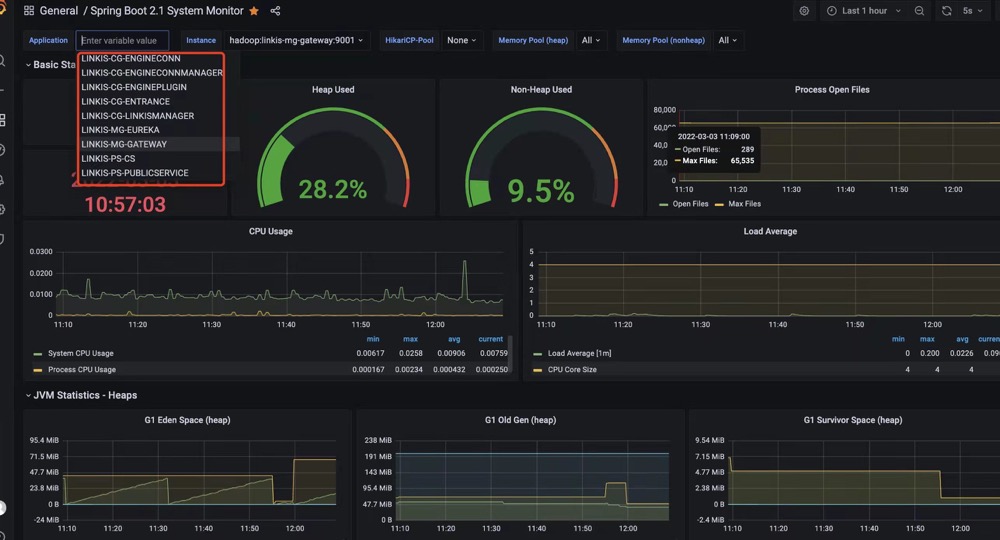
When the Grafana is accessible, you need to import the prometheus as datasource in Grafana, and import the dashboard template with id 11378, which is normally used for springboot service(2.1+). Then you can view one living dashboard of Linkis there.
You can also try to integrate the Prometheus alter manager with your own webhook, where you can see if the alter message is fired.